

An update of your schedule, budget and risks. This is similar to the usual status update, but with a focus on the team performance: did you meet your budget and schedule targets, is everything complete, are all risks closed? Show evolution of risks. Risk management can be included here or as its own section. Some teams have placed project management at the end of the report, which is also acceptable. It is not necessary to re-explain your entire project management and risk management strategy (refer to report where it is explained).
This section of the document will cover the overall project management and if the team has met their goals from this perspective of the project. Within this section the human resources budget, gantt chart for the schedule, and project risks and mitigation strategies will be covered and looked at more in depth.
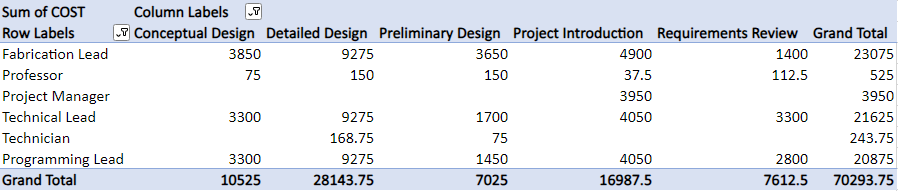
Budget
The final budget update can be seen in this section below. The final cost of the human resources used overall in this project has come to a total of $70 293.75 and the breakdown of the costs per phase can be seen below in figure X. Down below you can also see the updated human resources graph and since re evaluating the estimated costs the team has remained within a 20% accuracy from the estimated cost to the actual cost. The human resources graph can be found below in figure Y

Scheduling
Since the last update during the conceptual design phase, the team has progressed through the preliminary design phase, as shown by the Gantt chart in Figure 3. There are a couple of items outstanding in this phase, including obtaining some quotes or better estimates for the equipment and materials, along with getting into more detail in our prototyping and testing plans. The team has begun updating our procurement sheet with nozzles for testing and will be further updated with adapters and PVC tees/piping for the rainfall system.

Risk Mitigation
A dynamic risk registry (Appendix A) monitors and evaluates potential risks, including lobster mortality. Among the risks, lobster mortality stands out with the highest score, requiring immediate action. The team also added a new risk table for manufacturing risks, as shown in Appendix F, Table 2. In this table, it is seen that finding a subcontractor to fibreglass the bottom of the tank is the highest risk. While other risks may have lower individual scores, their cumulative effect can compound issues and heighten the project’s overall risk. Each identified risk is accompanied by specific response strategies and mitigation plans, providing a clear mitigation strategy for minimizing their impact.