The function of the Data Acquisition and Analysis subsystem is to collect the raw data from the control system during the testing process and process the raw data values gotten to get meaningful insights into how the design of a full-scale ship would be affected by the resistance of water and the effective horsepower needed based on its model scale values to determine if modifications could be made to the design or if it is seaworthy. This subsystem is composed of the HMI which collects and stores the data on a USB stick and the Excel Macro which is used to complete the Analysis and Report Generation.
Excel Macro/VBA coding
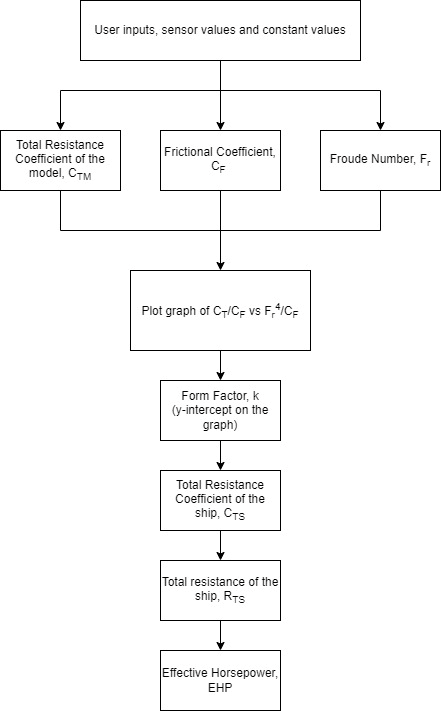
Using the process shown in Figure 1 below, an Excel Workbook was put together to automate the process for the analysis of the raw data imported using a USB stick from the Seimens KTP700 HMI basic panel. The Excel Macro satisfies the requirements for the Data Analysis system, which were validated through testing using sample randomly generated data and test data from the control system.
The Calculations will be completed using the International Towing Tank Conference (ITTC) documents for a resistance test which can be found here. The variables determined with this test are:
• Total resistance of the full-scale ship
• Ship speed for the full-scale ship
• Effective horsepower
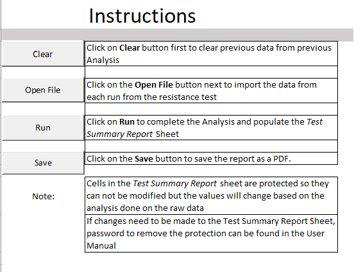
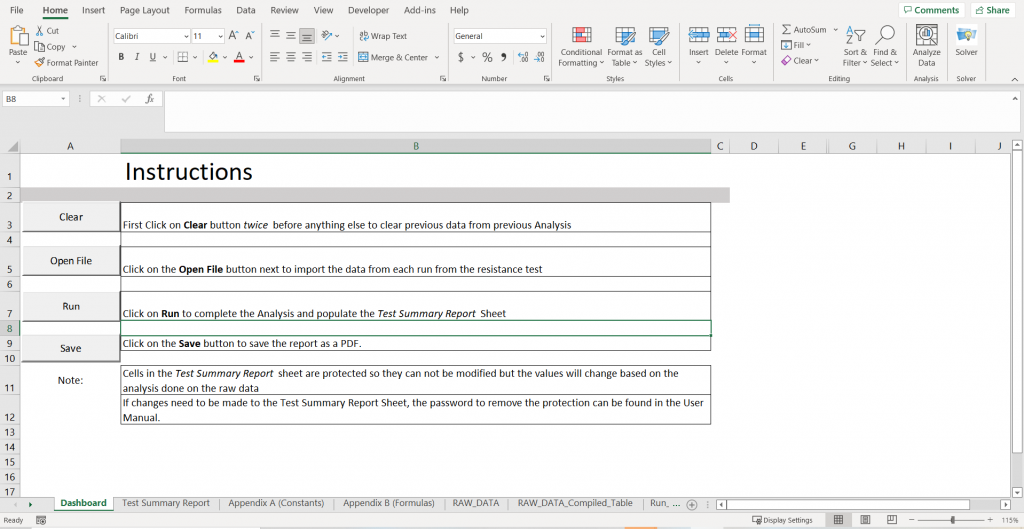
In order to automate the Data Analysis process, Macros and VBA code were used to program the different tasks to be completed. The image in Figure 2 below shows a screenshot of the Dashboard sheet with the command buttons which have the Macros and VBA code programmed into them. The user would just have to follow the instructions shown in the sheet to complete the analysis of the data by clicking on the respective command button. Clicking the button would trigger the Macros/VBA code to run.
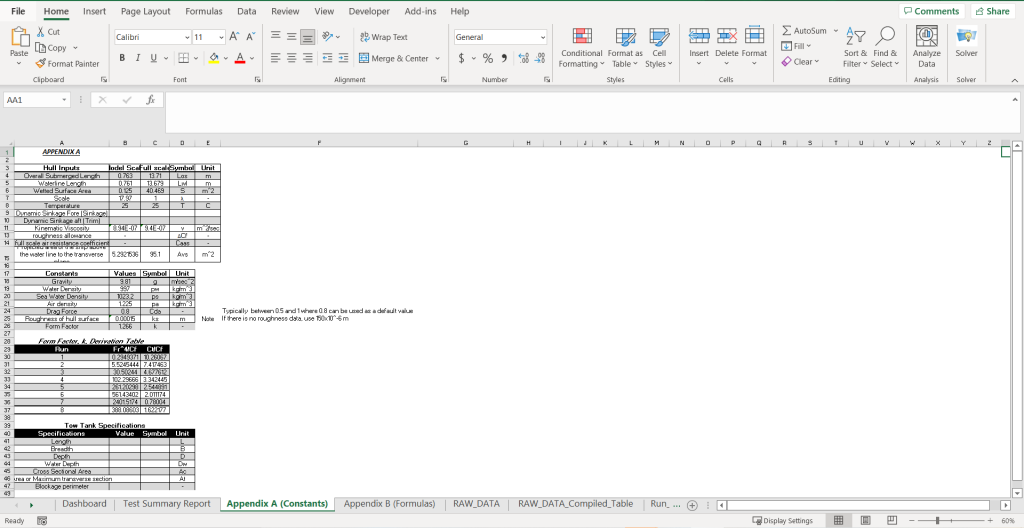
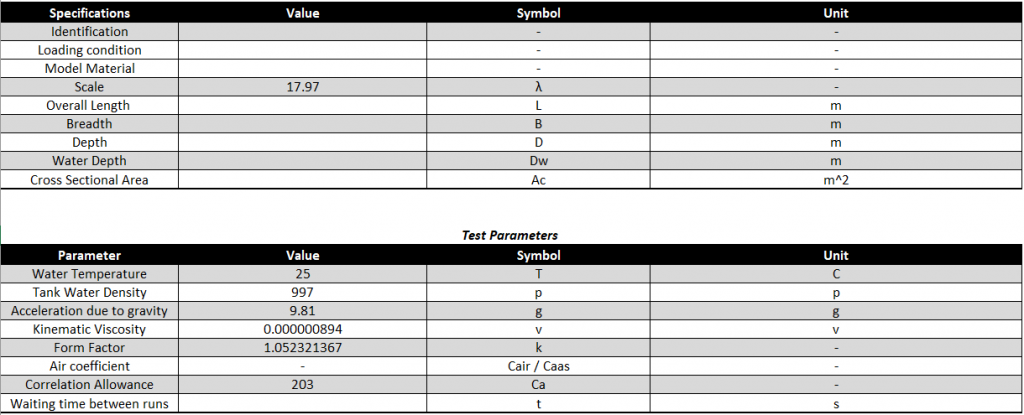
In order to complete the analysis and ensure that the calculated values are correct, the user would have to ensure that they fill out the model and specifications in Appendix A (Constants) sheet and fill out the sections shown in Figure 3 below. Once the values are entered, the calculated values would e adjusted based on the values entered.
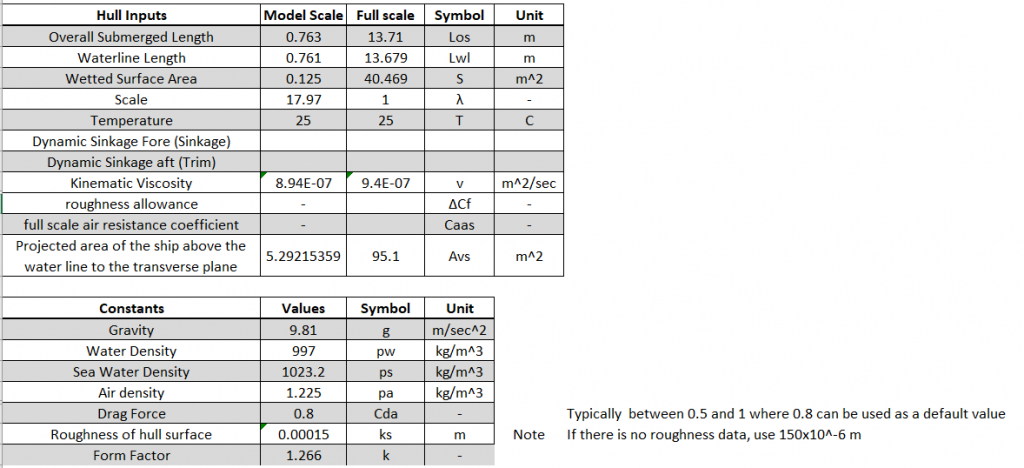
The full screenshot of the Dashboard and Appendix A (Constants) sheets can be seen in Figures 4 and 5 below respectively.
Report Generation
Once the analysis is completed, a summary test report would be generated for the User which they can save as a PDF. To complete the Test Summary Report, the blank sections of the following tables shown in Figure 6 below would have to be filled out before the summary report is saved. Once this is filled out, the Save command button can be pressed which would generate the Test Summary Report as well as the analysis data for reference as a PDF for the user to save in a different folder or external storage.
At the end of the project, the template for how the Sample Test Summary report would look was not yet finalised.